:format(webp))
The Essential Web Analytics Handbook
When you finish this guide, you’ll understand what web analytics is, why it matters, which tools and metrics to watch, and how to apply advanced techniques—like predictive models, privacy-friendly tracking and heatmaps—to make smarter decisions on your site.
What Is Web Analytics?
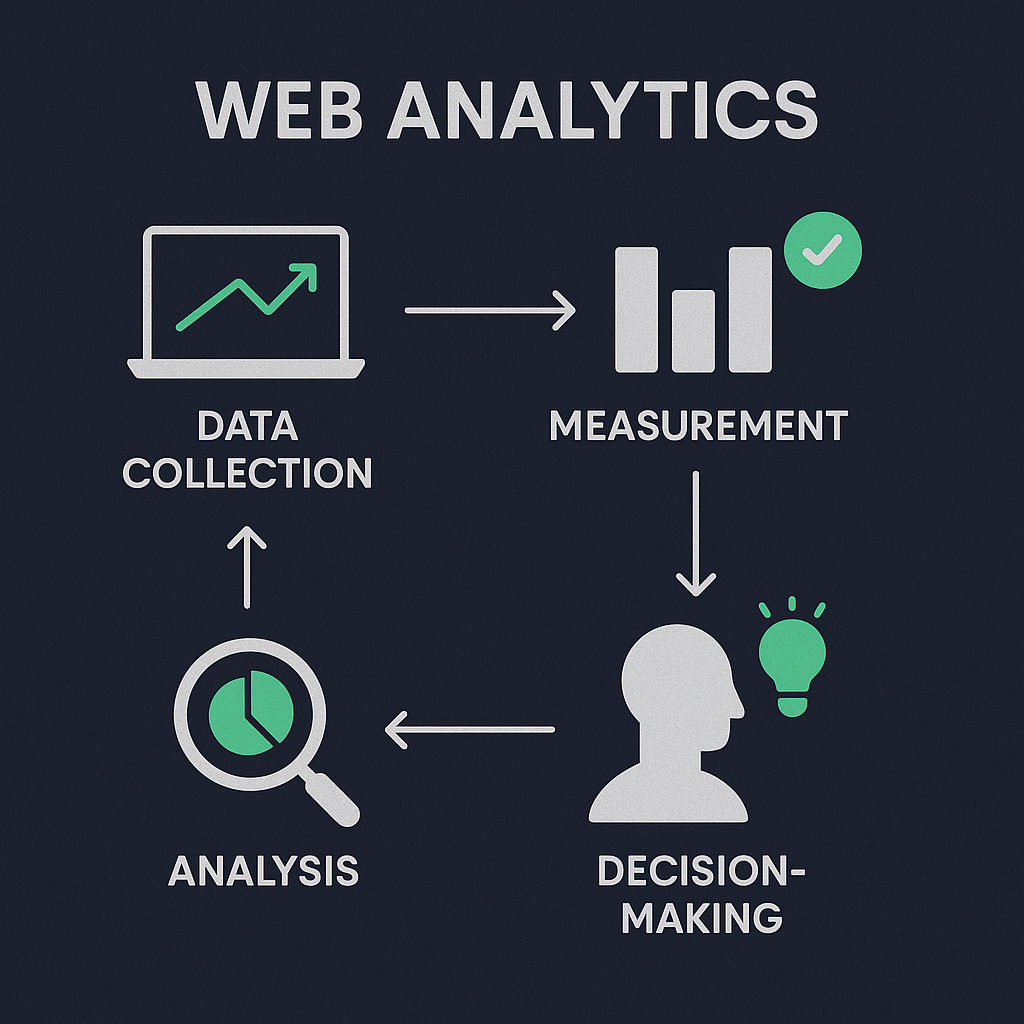
Web analytics is the process of collecting, measuring and analyzing data about how visitors interact with your website. It helps you see where traffic comes from, which pages engage users and which calls-to-action drive conversions.
Why Web Analytics Matters
Knowing how people use your site lets you refine design, content and campaigns so you can:
Enhance user satisfaction
Raise conversion rates
Allocate marketing spend wisely
According to a McKinsey report on data-driven organizations , organizations that adopt data-driven strategies are 23× more likely to acquire customers and 19× more likely to be profitable.
Without data, you’re just another person with an opinion.
– Avinash Kaushik, digital analytics expert
How Web Analytics Works
At its core, most analytics systems capture user interactions via small bits of code or server logs.
Client-Side Tracking
JavaScript snippets (tags) load in users’ browsers to record pageviews, clicks and form submissions. See the Google Tag Manager quickstart guide for implementation details.
Server-Side Tracking
Data is collected on your own servers before it’s sent out. This method bypasses ad blockers and aligns better with strict privacy rules, as explained in Segment’s server-side tracking overview .
Key Metrics and KPIs
Track these to gauge site performance:
Unique visitors
Pageviews
Bounce rate (percentage of single-page sessions)
Exit rate (how often a page was the final one viewed)
Conversion rate (completed goals ÷ sessions)
Average order value (total revenue ÷ number of orders)
Customer lifetime value (projected net profit per customer)
Time on page
Metric | Definition |
|---|---|
Unique visitors | The number of distinct individuals who visit your website. |
Pageviews | The total number of times pages on your site are viewed. |
Bounce rate | Percentage of single-page sessions where users leave without interacting further. |
Exit rate | The ratio showing how often a specific page was the last one viewed in a session. |
Conversion rate | The percentage calculated as completed goals divided by total sessions. |
Average order value | Total revenue divided by the total number of orders placed. |
Customer lifetime value | The projected net profit attributed to the entire future relationship with a customer. |
Time on page | The average amount of time visitors spend on a specific web page. |
Visualizing Behavior with Heatmaps
Heatmaps, scroll maps and session replays show where people click, how far they scroll and which elements distract them—insights you don’t get from numbers alone. For example, Hotjar’s heatmaps illustrate user engagement patterns in real time.
Popular Web Analytics Tools
Google Analytics (free & enterprise options)
Adobe Analytics (robust, suited to large enterprises)
Matomo (open-source, self-hosted)
Clicky (real-time interface)
Tableau (data visualization & reporting)
Tool | Pricing Model | Key Features | Best For |
|---|---|---|---|
Google Analytics | Free & Paid (GA4 360) | Web analytics, user tracking, integrations | Businesses of all sizes |
Adobe Analytics | Enterprise (Custom pricing) | Deep analysis, segmentation, customizable reports | Large enterprises |
Matomo | Free (self-hosted) & Paid (cloud) | Open-source, privacy-first, customizable dashboards | Organizations needing control & privacy |
Clicky | Free (limited) & Paid plans | Real-time analytics, heatmaps, uptime monitoring | Small to medium businesses |
Tableau | Paid | Data visualization, reporting, dashboards | Data-driven teams & analysts |
Advanced Practices Shaping the Future
Privacy Regulations
Laws like the General Data Protection Regulation (GDPR) in the EU and the California Consumer Privacy Act (CCPA) require you to obtain user consent, limit data retention and anonymize personal identifiers. Failing to comply can lead to fines up to €20 million or 4% of global turnover.
Regulation | Region | Consent Requirement | Data Retention Limit | Penalty |
|---|---|---|---|---|
GDPR | European Union | Explicit, informed consent | Must be limited to need | Up to €20 million or 4% global turnover |
CCPA | California, USA | Right to opt-out (sale of data) | None specified; must inform users | Up to $7,500 per violation |
CRM and Ad-Platform Integration
Linking analytics with CRM systems (e.g., Salesforce Analytics Cloud ) and ad platforms (Google Ads, Facebook) creates a unified view of user journeys—so you can attribute revenue back to individual campaigns.
Predictive Analytics
Machine-learning models forecast visitor behavior, flag at-risk users and identify high-value segments before patterns fully emerge. Learn more in SAS’s overview of predictive analytics .
Next Steps for Data-Driven Success
You now have the foundation to implement web analytics from basic tracking to advanced forecasting, all while respecting user privacy. Start by selecting a tool, defining key goals and mapping your customer journey—then watch the data guide your way.
:format(webp))
:format(webp))
:format(webp))