:format(webp))
How to Build a High-Performance Real-Time React Dashboard

In this guide, you’ll learn how to plan, build, and deploy a React dashboard that streams live data smoothly, stays responsive under load, and handles network hiccups without breaking a sweat. You’ll see core setup steps alongside advanced strategies—like client-side windowing, backpressure control, and browser observability—to make your dashboard feel instant.
Planning and Initial Setup
Before writing code, decide on your dashboard’s purpose, audience, and data sources. Sketch a rough layout: charts, tables, filters, and summary cards. Then:
Install Node.js and npm (or Yarn).
Scaffold with Create React App :
```bash
npx create-react-app my-dashboard
cd my-dashboard
```
Add essential libraries:
- WebSocket or Pusher client
- Charting toolkit (e.g., Recharts or Chart.js)
- State manager (Context API or Redux)
- Utility libraries (date-fns, lodash)
Real-Time Data Integration
A key choice is your streaming transport:
WebSockets : bi-directional, low latency, widely supported.
Server-Sent Events (SSE) : one-way stream, simpler auth, auto-reconnect.
GraphQL Subscriptions : schema-driven, integrates with Apollo.
MQTT over WebSockets: for IoT use cases with pub/sub.
Transport | Directionality | Latency | Auth Complexity | Reconnect Support | Use Case |
|---|---|---|---|---|---|
Bi-directional | Low | Medium | Manual | General real-time apps | |
Unidirectional | Low | Simple | Automatic | Live feeds | |
Bi-directional | Low | Complex | Automatic | Schema-driven updates | |
MQTT over WebSockets | Bi-directional | Very Low | Complex | Manual | IoT pub/sub |
“In live interfaces, picking the right channel can cut perceived latency in half.” — Jeffrey Hammond
Statistic: modern dashboards often use WebSockets for real-time updates, with over 54% of React projects adopting them in 2023 .
Managing High-Frequency Streams
When events arrive dozens of times per second, uncontrolled renders cause jank. Use these tactics:
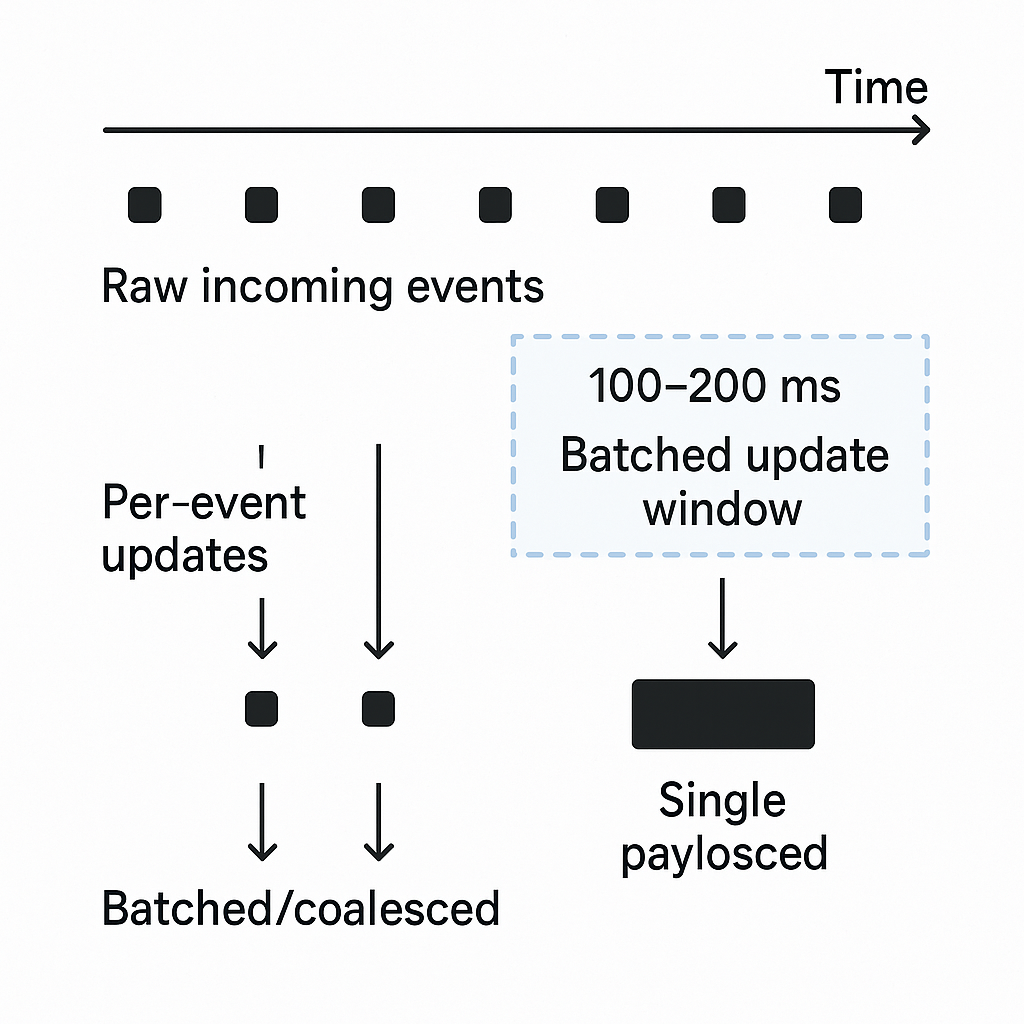
Batching: collect events for 100–200 ms, then update state once.
Coalescing: merge multiple events into a single payload.
Snapshot + Delta: send a full state snapshot periodically, then small diffs in between.
By limiting renders to 10–15 fps, you keep animations smooth and CPU use in check.
Client-Side State Modeling with Time Windows
For rolling KPIs—like 1-minute or 5-minute averages—you can compute on the fly without reprocessing all data:
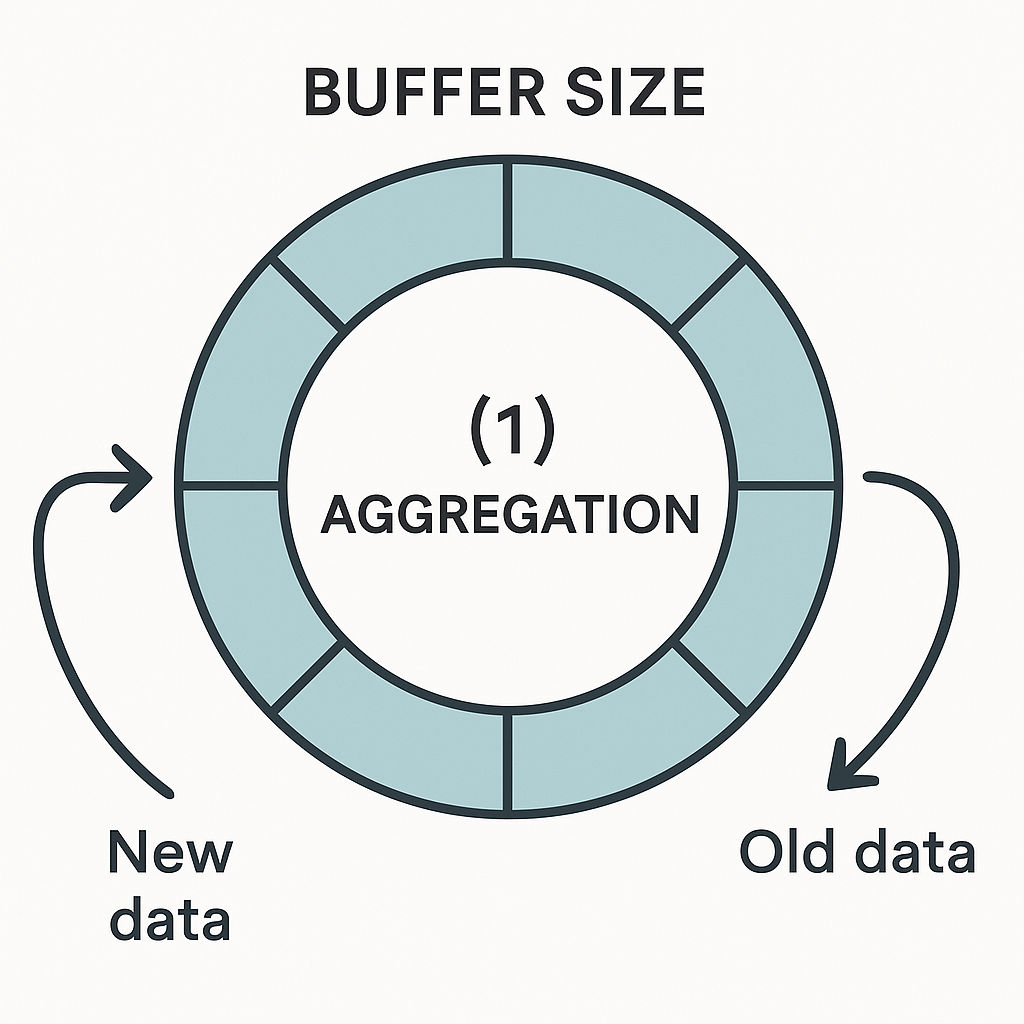
Maintain a ring buffer for each metric.
On new event, push to buffer, pop if outside window.
Recompute aggregation (sum, count, max/min) in O(1) time.
This tumbling or sliding window approach ensures your charts update instantly even as data streams continuously.
Offloading Heavy Workloads
Move intensive tasks off the main thread:
Web Workers : calculate aggregations and perform downsampling.
OffscreenCanvas : draw complex chart frames without blocking UI.
This edge aggregation keeps your dashboard responsive under peak loads.
Incremental Chart Rendering
Large time-series need level-of-detail tactics:
Use virtualized series so only visible points render.
Apply Largest-Triangle-Three-Buckets (LTTB) or min-max downsampling for overviews.
Dynamically adjust sample rate on zoom or pan.
These techniques prevent the browser from choking on thousands of points.
Data Consistency Patterns
Decide your consistency model:
Eventual UI consistency: updates may arrive out of order but converge.
Strong UI consistency: enforce strict sequence with acknowledgments.
Implement optimistic updates for user-driven changes, then reconcile conflicts via server timestamps or vector clocks to resolve late events.
Schema Evolution and Contract Testing
Streaming APIs evolve—fields get added or deprecated. Use:
Protocol Buffers or Avro with backward-compatible fields.
Contract tests to validate incoming payloads against expected schemas.
This prevents silent dashboard breakage when backend teams deploy new message versions.
Observability in the Browser
Track real-time performance metrics:
Measure render duration, dropped frames, and event lag.
Trace from socket receive to paint to see where delays occur.
Toggle feature flags to disable noncritical widgets during spikes.
With these insights, you can detect performance regressions before users do.
Security and Access Control
Protect your streams and data:
Rotate access tokens frequently and scope them by tenant.
Authorize channels per component to avoid over-exposure.
Redact PII in both in-memory caches and logs.
Implement attribute-based access control to filter sensitive metrics at query time.
Offline Tolerance and UX Resilience
Even real-time apps must handle disconnections gracefully:
Fall back to polling with exponential backoff.
Queue outbound actions locally and reconcile on reconnect.
Show freshness indicators (e.g., a “stale” badge) when data is out of date.
This ensures users can still view last-known values rather than a blank screen.
Testing Real-Time Flows and Performance Budgets
Maintain quality with:
Time-controlled unit tests using fake timers.
Contract tests for streaming payload validity.
Visual regression tests under simulated event bursts.
Runtime guards that enforce ceilings (e.g., max 1,000 points per chart, no more than 20 renders/sec).
These checks help you find issues before they reach production.
Server-Side Rendering and Initial Load
Combine React Server Components for a fast first paint:
Render static snapshot of critical widgets on the server.
Hydrate with live updates on the client.
This pattern reduces time-to-first-insight while keeping your dashboard fully interactive.
Next-Level Dashboards
You now have a blueprint for building dashboards that stay smooth under heavy stream loads, recover gracefully from network blips, and offer strong data safety. By applying these strategies—client-side windowing, backpressure control, edge aggregation, and comprehensive testing—you’ll deliver a real-time experience that feels immediate, reliable, and secure.
:format(webp))
:format(webp))
:format(webp))