Google Core Web Vitals is the newest form of web performance metrics launched by Google to measure website performance. Its metrics look into real world usage data, aggregated across user devices.
Starting May 2021, core web vitals will affect your page rank
This is possible using the browser performance API. Below is the version 6 (v6) scoring calculator used by Google Lighthouse today for web page performance benchmarking.
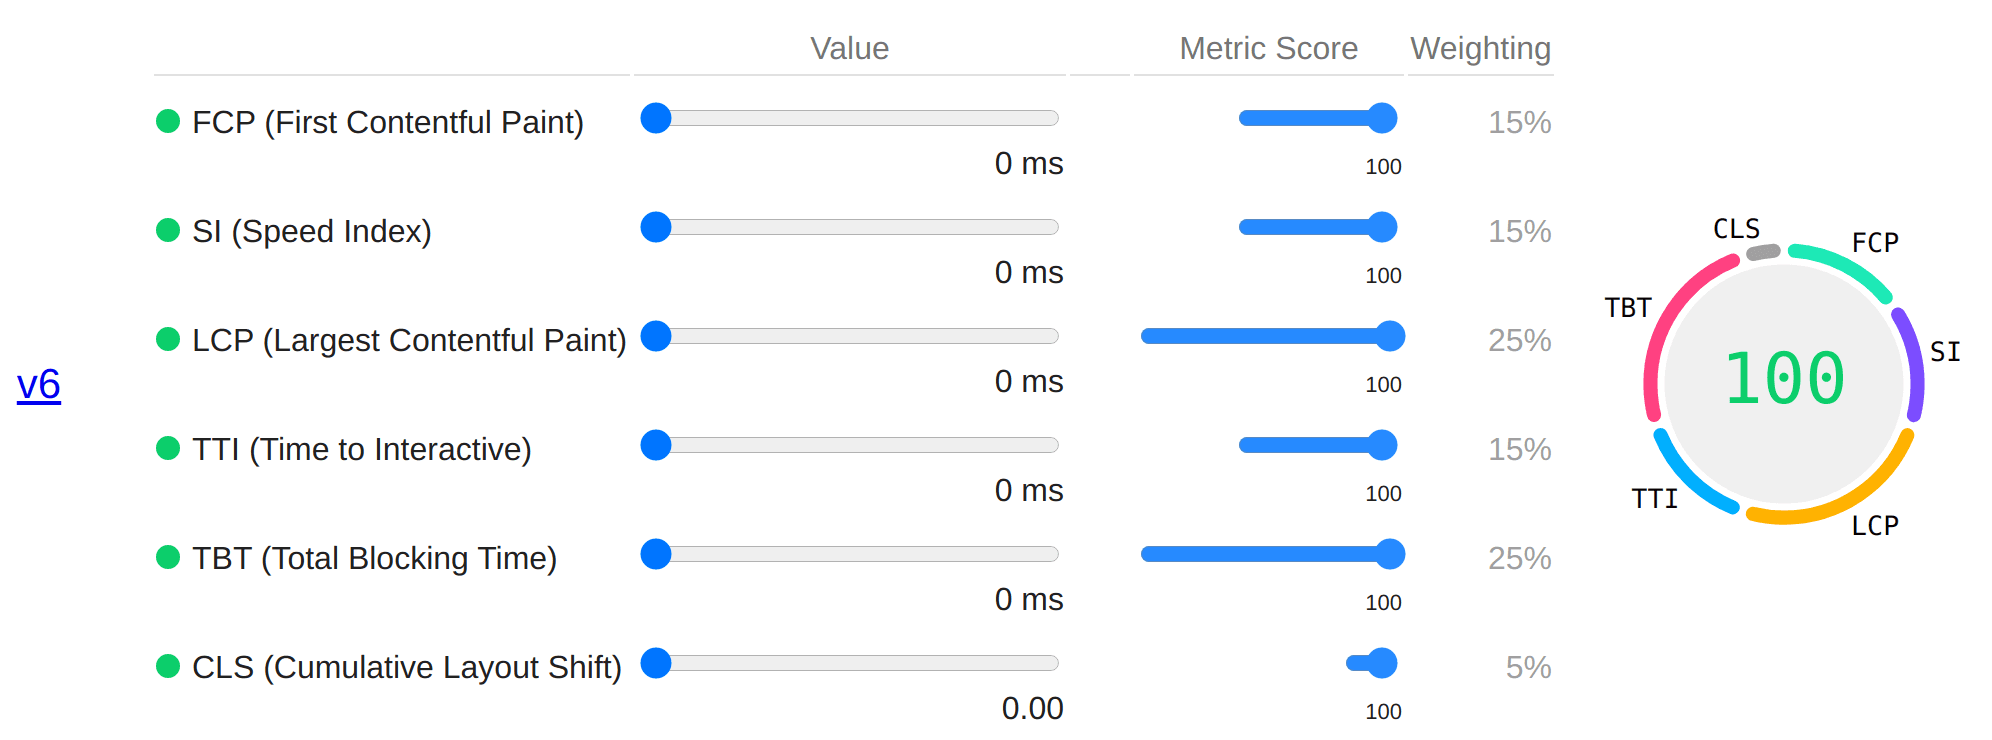
Yes, starting May 2021, core web vitals metrics will become a top seo ranking metric according to Google.
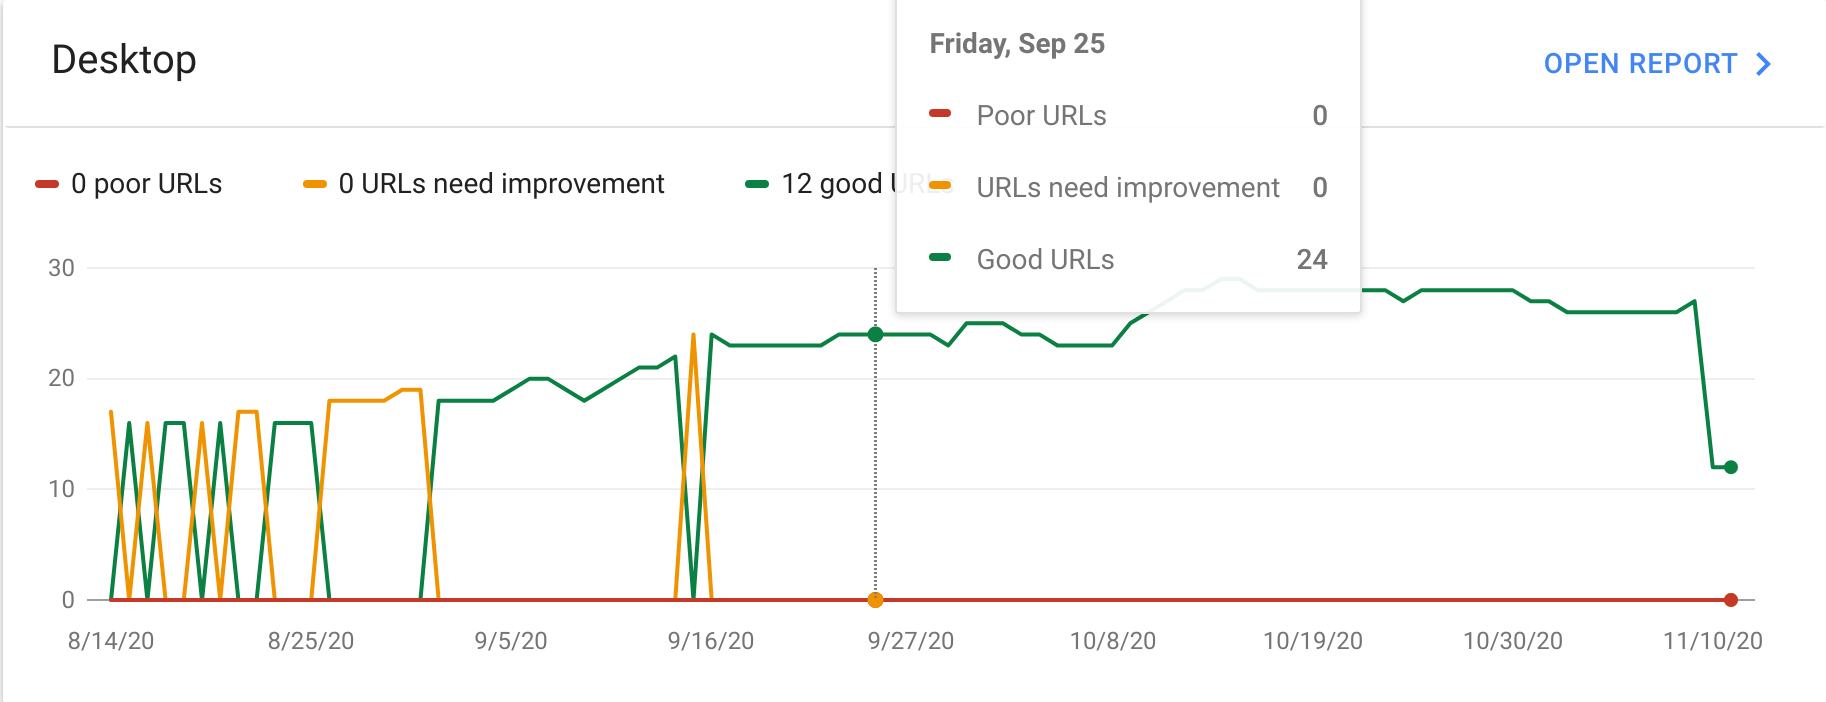
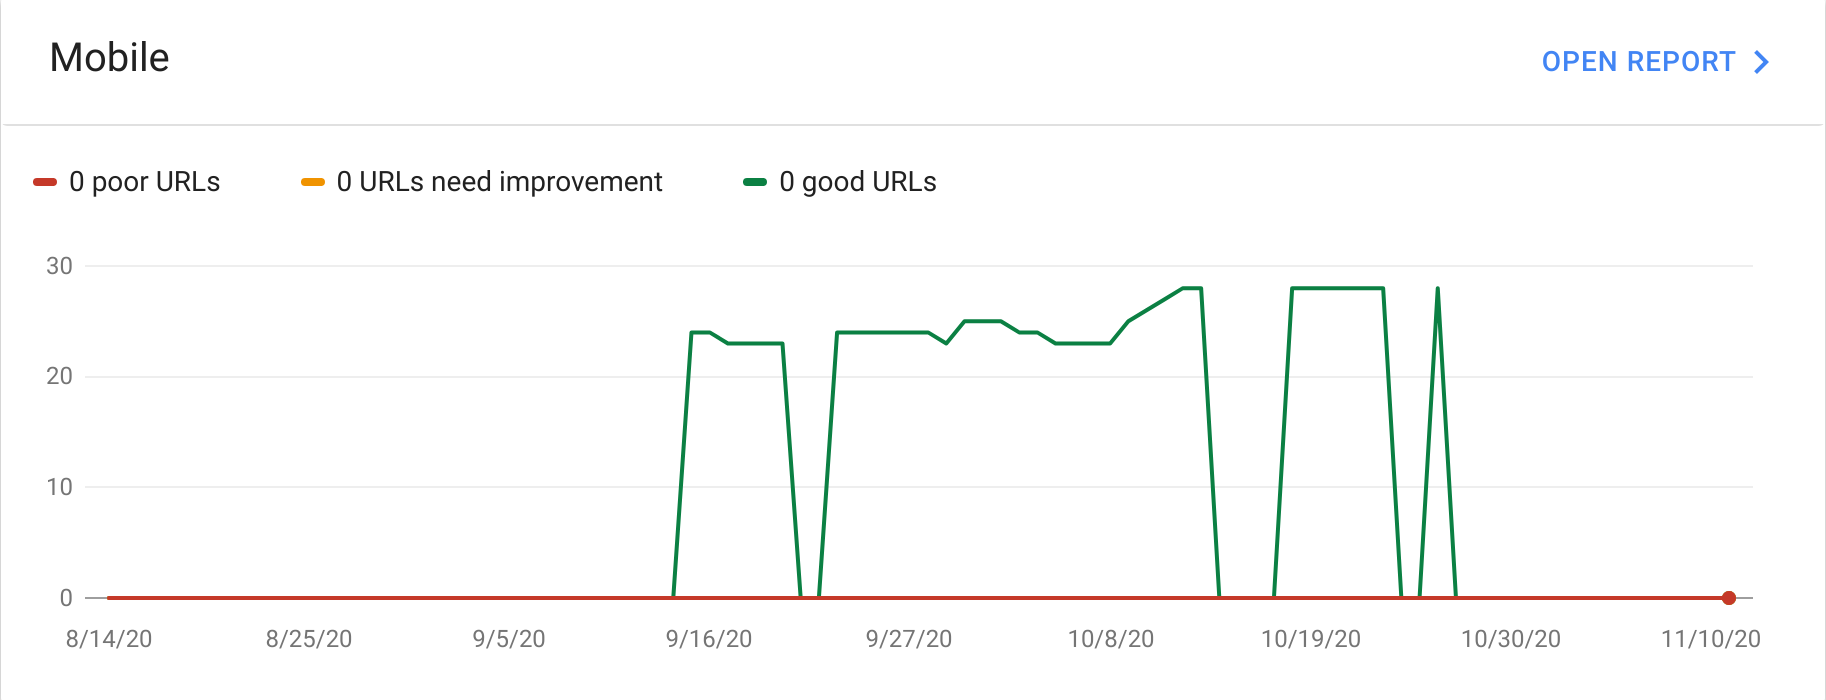
The search engine giant has been investing in this and provided a section on Google's Search Console for website owners to see real-world metrics gathered on their web pages.
The report has separate sections for desktop and mobile experiences.
As the name suggests, these are core web attributes of a web page that users experience on their load and usage. For example:
How long does it take before I see any meaningful painting on the page?
How long does it take before images are displayed on the page?
Why do page elements like text and images shift positions shortly after the load?
That's super annoying!
Why is it that even though I click a button, it takes ages for it to react?
In fact, sometimes nothing happens, and I have to click again!
All of these are common problems we see on the web today.
These are precisely the sort of issues the 6 Core Web Vital metrics try to analyse. After careful research carried out by Google's web performance group, benchmarks have been laid out to classify web pages into three categories based on their measurements.
Good
Needs Improvement
Poor
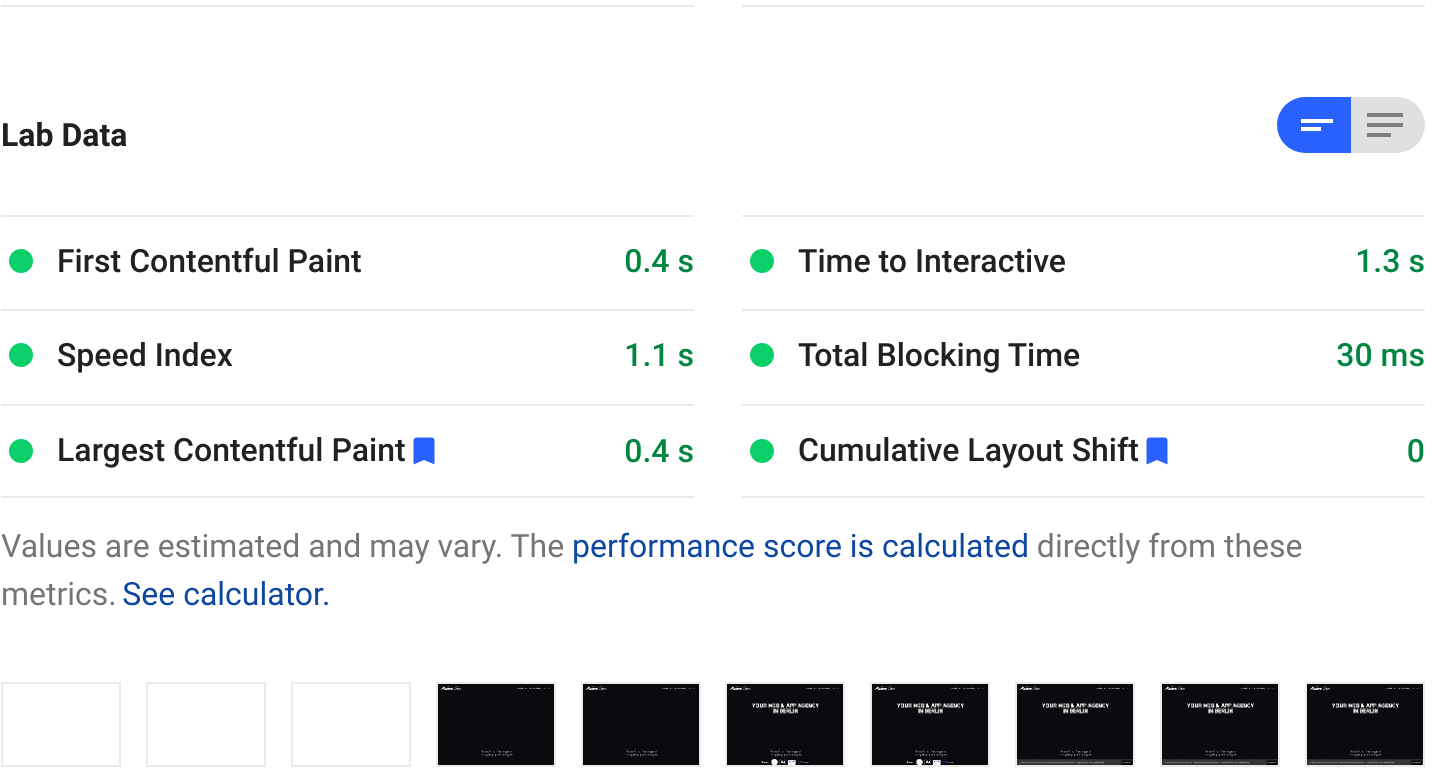
Let us take a quick glance at the 6 metrics, each addressing one of the problems above. The 6 core web vitals are
First Contentful Paint
Largest Contentful Paint
Total Blocking Time
Cumulative Layout Shift
Speed Index
Time to Interactive
1. First Contentful Paint, FCP
First Contentful Paint measures the time it takes for the browser to draw a meaningful thing on the page. When we browse, the browser sends network request, and it starts downloading the page, at this time, all we see on the page is a white screen.
First Contentful Paint measures the time it takes for something to appear on the white screen.
As a site owner or developer, it is very important that you understand why your first contentful paint is not green, because a green First Contentful Paint goes a long way into boosting your Largest Contentful Paint [LCP], especially for image-based large contentful paints. (We'll elaborate on LCP below.)
At Makers' Den, we have had a lot of experience with Google Core Web Vitals and I can tell you that if your FCP is not green, image-based largest contentful paints will most of the time be classified as needs improvement or poor.
Various ways to optimize First Contentful Paint include:
Use and optimize your cdn, make sure file compression is enabled, and use http2
Lower your html size, serve other related content dynamically after page load or during user interactions.
Lower your bundle size. Apply tree shaking as needed, and dynamically load-scripts.
Reduce server response time, either by increasing the server capacity, or running less work before returning to the client.
2. Largest Contentful Paint, LCP
Largest Contentful Paint [LCP], is related to First Contentful Paint [FCP].
Here, we are interested in knowing how long it takes to fully render the largest element in the viewport.
For websites with image banners, news websites, blogs, images are usually the largest element within the viewport and not text elements.
You need to optimise for this using the strategies below:
Ensure all image elements within the viewport are eagerly loaded and not lazily loaded.
Ensure that image elements within the viewport are preloaded using the Link rel='preload' meta tag. Modern browsers such as Chrome already handle situations like this for you, by prescanning the html and preloading images it feels will be in the viewport.
Avoid complex css styling that is difficult for the browser to paint, and keep your html simple.
For React-based sites using re-hydration (GatsbyJs or NextJS), ensure sure your html is not cleared and re-rendered again unnecessarily.
Lastly, make the chrome performance tab your friend, run it, and look at how your website performs in the network tab.
Most websites today are affected by the poor performance of Largest Contentful Paint.
3. Time to Interactive, TTI
How long does it take before your website becomes responsive to user clicks? You must have had the experience where a website looks as though it is fully loaded and ready to go, but when you click on a button, nothing happens. That is what Time to Interactive measures.
Time to Interactive measures how long it takes for a web page to respond to input events or other user gestures.
Here is a list of strategies to help in solving these issues
Preload all core javascript files, and ensure you only preload what is needed to start up your web page
Defer all other scripts and load other scripts after the user has interacted with your page, as deferred and async scripts can still harm performance
Use the performance tab in Chrome to audit your javascript logic, functions, and reduce their execution times. This goes a long to improve TTI.
Apply suggested solutions for First Contentful paint
4. Cumulative Layout Shift, CLS
It is common today that web page elements such as text, videos, or images fly all over the place, shifting positions. The end result is that the user perceives the web page as "jumping". You might see a button at a certain position, and in a few seconds, it shifted a hundred pixels below. That is what Cumulative Layout Shift measures.
Cumulative Layout Shift measures how much your page elements shift positions during initial load
This is easier to solve. Below are steps you can use to solve Cumulative Layout Shift CLS issues on your pages.
Elements such as audio, video, and image should have defined width and height. This ensures that the position and dimensions of the element is static before and after the asset loads.
Ensure you preload fonts, and utilize the font-display: swap css property.
Avoid adding or removing elements without user interaction, causing jumpy content.
Have empathy for the user - think about how the page will be experienced.
5. Speed Index
Speed Index shows how quickly the contents of a page are visibly populated
How quickly your network requests finish and how quickly it renders your page will affect this.
Use service workers to cache resources, it will help your speed index.
6. Total Blocking Time, TBT
Total Blocking Time is reported in Google Search Console as First Input Delay [FID].
Total Blocking Time is a measure of how long it takes for a function that runs on the main thread to execute and return in excess of 50ms.
For weak mobile devices, the time you spend parsing Javascript even without executing it can dramatically affect this metric. When you have to run intensive code, try splitting up the execution into chunks, to ensure it never blocks for too long.
According to Google, Core Web Vitals will be used and incorporated into their search rankings starting in 2021. The search giant has been making updates to the search console to show website owners how their websites are performing.
In the search console, under the Enhancement menu section, you will find Core Web Vitals. Google marks your pages as either Good, Needs Improvement, or Poor.
Below is an example of a detailed core web vitals report in Google's Search Console. As stated earlier, the sections are divided into three.
Poor
Needs Improvement
Good
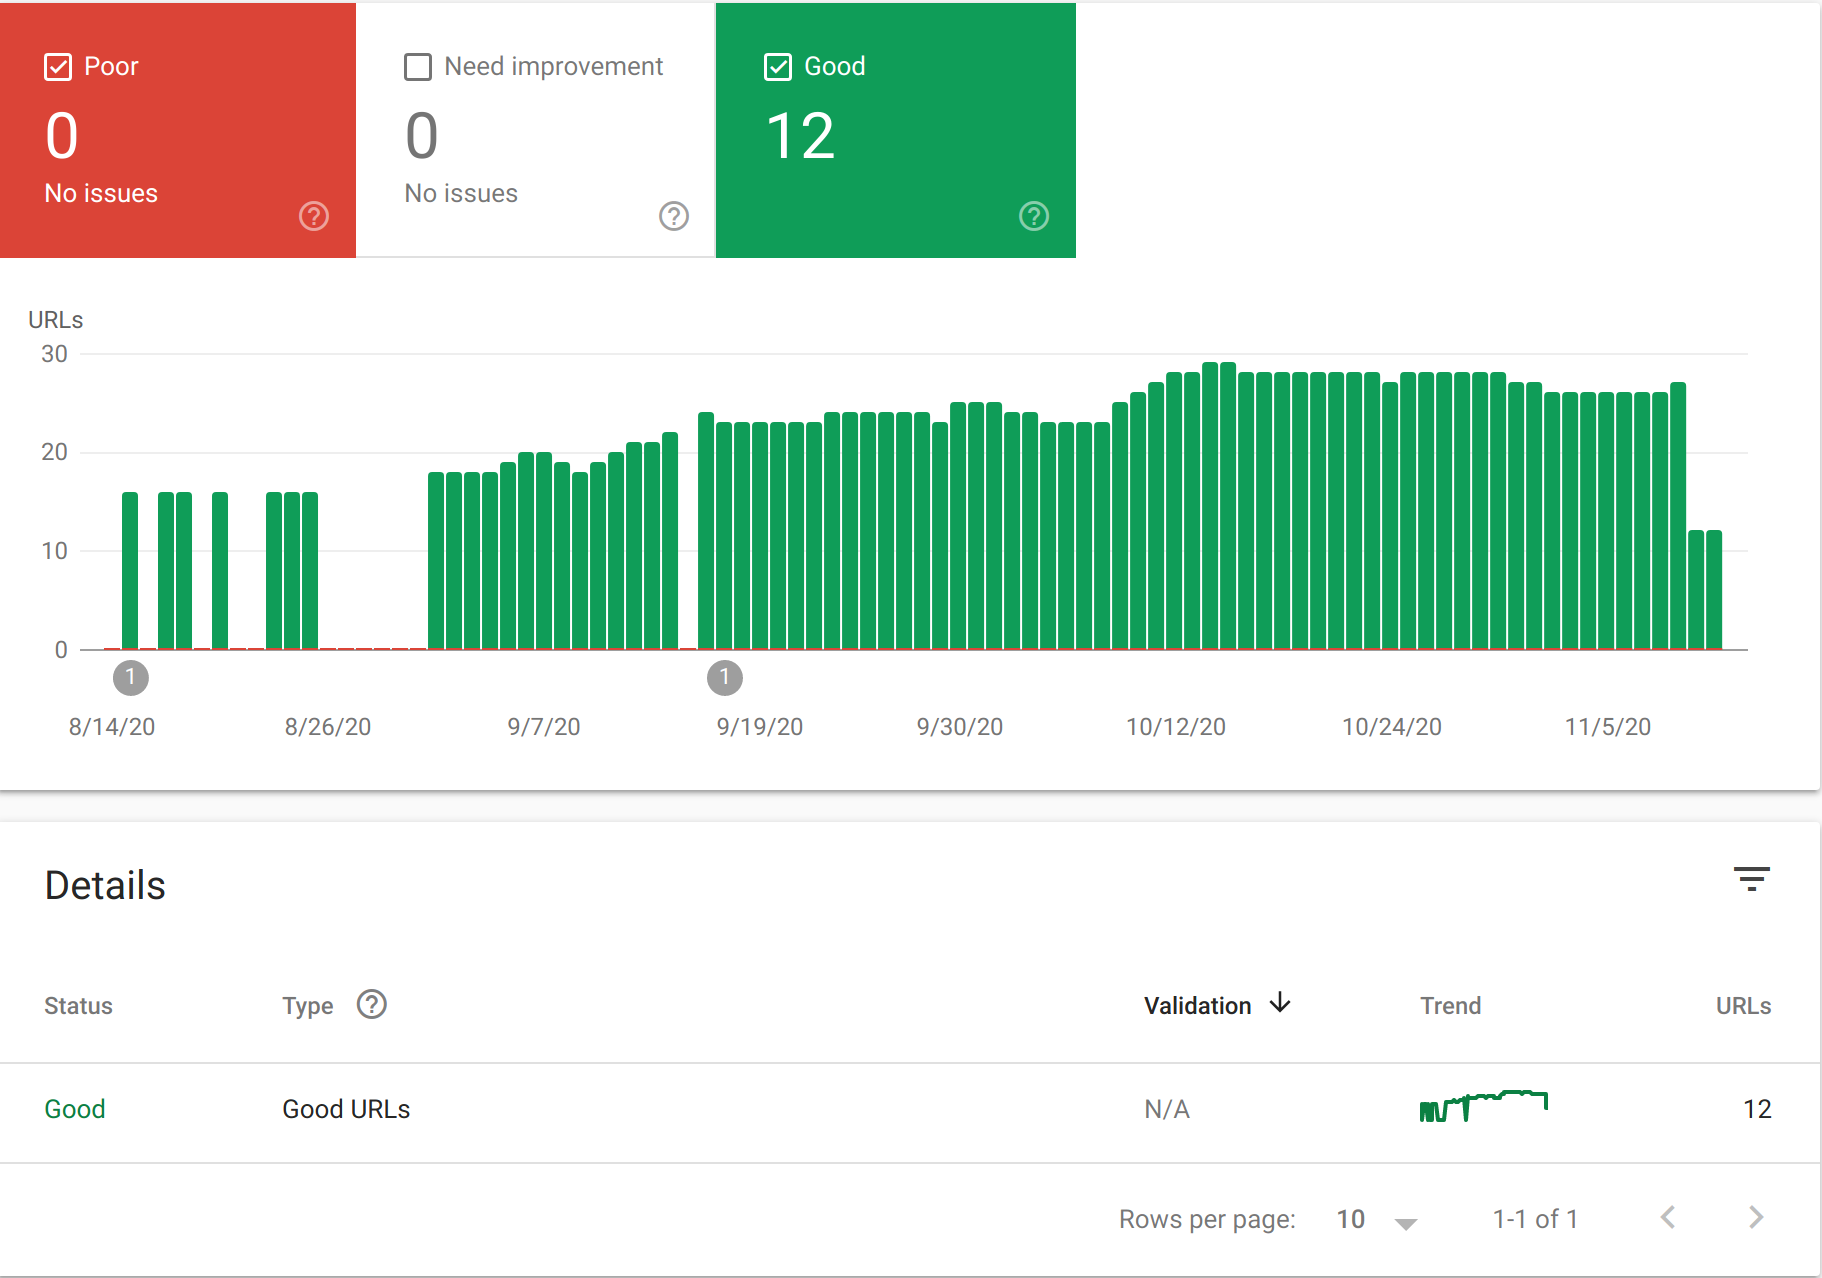 The intent is to help site owners to see which URLs on their websites are underperforming. They can then use tools like Lighthouse to see which exact metric is underperforming and which will help them fix the issues.
At Makers' Den, we've dealt with a fair amount of these issues. If you feel you may need an inspection or help resolving tricky performance problems, don't hesitate to get in touch.


