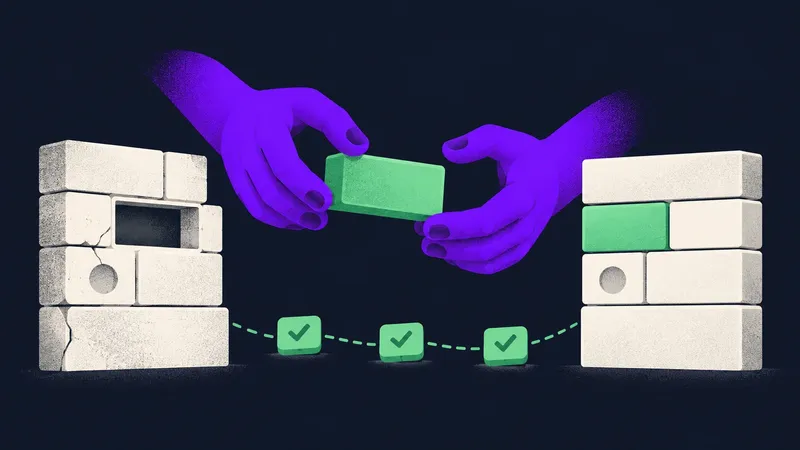
An agent that reads confidential documents must be supportable without making those documents available to its engineers. That changes the order of work: define the data boundary first, then design telemetry, customer-approved review and evaluations that operate within it. Otherwise, the first difficult production failure will tempt the team to expand tracing access after the fact.
The usual debugging workflow breaks on confidential work
Suppose a customer reports that an agent missed a restriction in a document review. The customer can see the document, the agent’s answer and the consequence. Your engineer may see only a failed workflow ID. Asking for the complete prompt and trace is an understandable debugging instinct, but it may expose material the customer had no authority to share with the vendor routinely.
This is a real operating constraint, not a hypothetical objection to observability. In a November 2026 interview, Legora CTO Jacob Lauritzen described why his team cannot routinely inspect customer agent traces: the underlying material is confidential and often belongs to law firms’ clients. That does not mean support access is categorically impossible. Legora’s security policy says engineers can receive access to customer data for support issues with written customer approval. It also says customer data is not used to train or fine-tune models; consented support review and model training are different decisions.
For a CTO, the important distinction is between an exception and the default workflow. If engineers need to read customer documents to diagnose ordinary failures, the product’s support model conflicts with its data boundary. If review is exceptional, authorized and scoped to a specific report, the team can still investigate difficult cases without treating every production interaction as a potential developer fixture.
Decide what may leave the boundary before selecting a tracing tool
Start with a field-level map, not a dashboard purchase. Include prompts, retrieved passages, outputs, tool arguments, exceptions, traces, support tickets and evaluation datasets. For each field, record what collects it, where it goes, how long it remains, who may read it and whether customer authorization is needed. Include exports to vendors and support systems, not just your application database.
This matters because agent tracing often captures more than teams expect. Microsoft Foundry’s tracing documentation warns that traces can contain prompts, outputs, tool calls and customer content. Access to the connected Application Insights or Log Analytics resource can expose that material to readers. Disabling tracing stops new collection; it does not erase records already collected.
Nor is a message-capture switch a complete inventory of what an SDK sends. Microsoft’s client-side tracing guidance says message-content capture is off by default and should not be enabled in production unless privacy requirements permit it. But its Python @trace_function decorator records function parameters and return values regardless of that setting. A document excerpt passed as a helper argument can therefore enter telemetry even when message capture appears disabled.
Protected storage is useful when collection is authorized. Microsoft documents a separate protected table for sensitive generative-AI trace fields, including gen_ai.input.messages, gen_ai.output.messages and gen_ai.tool.call.arguments. Check the current implementation before relying on it because the documentation marks some features as preview. More importantly, restricted access to collected content does not satisfy a rule that the vendor must not collect that content at all.
This is the confidential-data exception to the common advice to export full prompts, responses and traces for debugging. Full traces can be appropriate where the customer has authorized that collection and its controls. They should not become the default merely because an observability setup for less restricted agents would benefit from them.
Instrument decisions and failures without recording the matter
Ship an allowlisted operational event schema. A useful event might contain a correlation ID, a tenant-scoped pseudonymous identifier where justified, workflow step, tool and model identifiers, application and prompt versions, policy version, duration, token counts, a bounded error category, and approval or authorization outcome. Those fields help answer whether a regression followed a deployment, whether a tool timed out repeatedly, or whether a permission check denied an action.
Keep filenames, document titles, raw customer IDs, snippets and arbitrary exception strings out by default. Even apparently harmless identifiers can reveal a matter. An exception that embeds a failed request or tool argument can defeat an otherwise careful schema. Use fixed error categories instead of attaching whatever the library emitted. OWASP’s logging guidance recommends enough event context to investigate operations while generally excluding sensitive personal and commercially sensitive information. It also makes clear that logging requirements should be decided during design, not copied from a universal checklist.
The instrumentation boundary must be enforced at collection and export, not just in a dashboard view. OpenTelemetry notes that instrumentation cannot know what is sensitive in a particular deployment. Its Collector processors can remove or modify attributes, filter spans and retain only allowlisted attributes. Prefer emitting only approved fields in the first place, then use the Collector as another control.
Test the actual exported payload. Seed recognizable confidential strings in prompts, tool results, errors and parameters passed through custom traced functions. Follow them through SDK output, Collector processing, baggage, support exports and stored records. Check old records separately if collection was previously enabled. A clean dashboard proves little if the underlying trace store still holds the seeded string.
Be precise about what this buys you. Content-free telemetry can identify latency, retries, failed tools, version-specific regressions and denied actions. It usually cannot establish whether a legal conclusion was correct. An operational event showing that a permissions check passed is also not a substitute for a properly designed authorization audit record. Permission enforcement still belongs at the tool and resource boundary, where the requested action can actually be checked.
Give customers control over failure review
Add a “report this result” path inside the customer’s workspace. An authorized customer reviewer should select the exact interaction or excerpt, inspect what will be shared, state the support purpose and approve a defined expiry. Route that disclosure to a separately permissioned support store rather than opening routine telemetry to engineers. Record the authorization and provide the agreed deletion or revocation process.
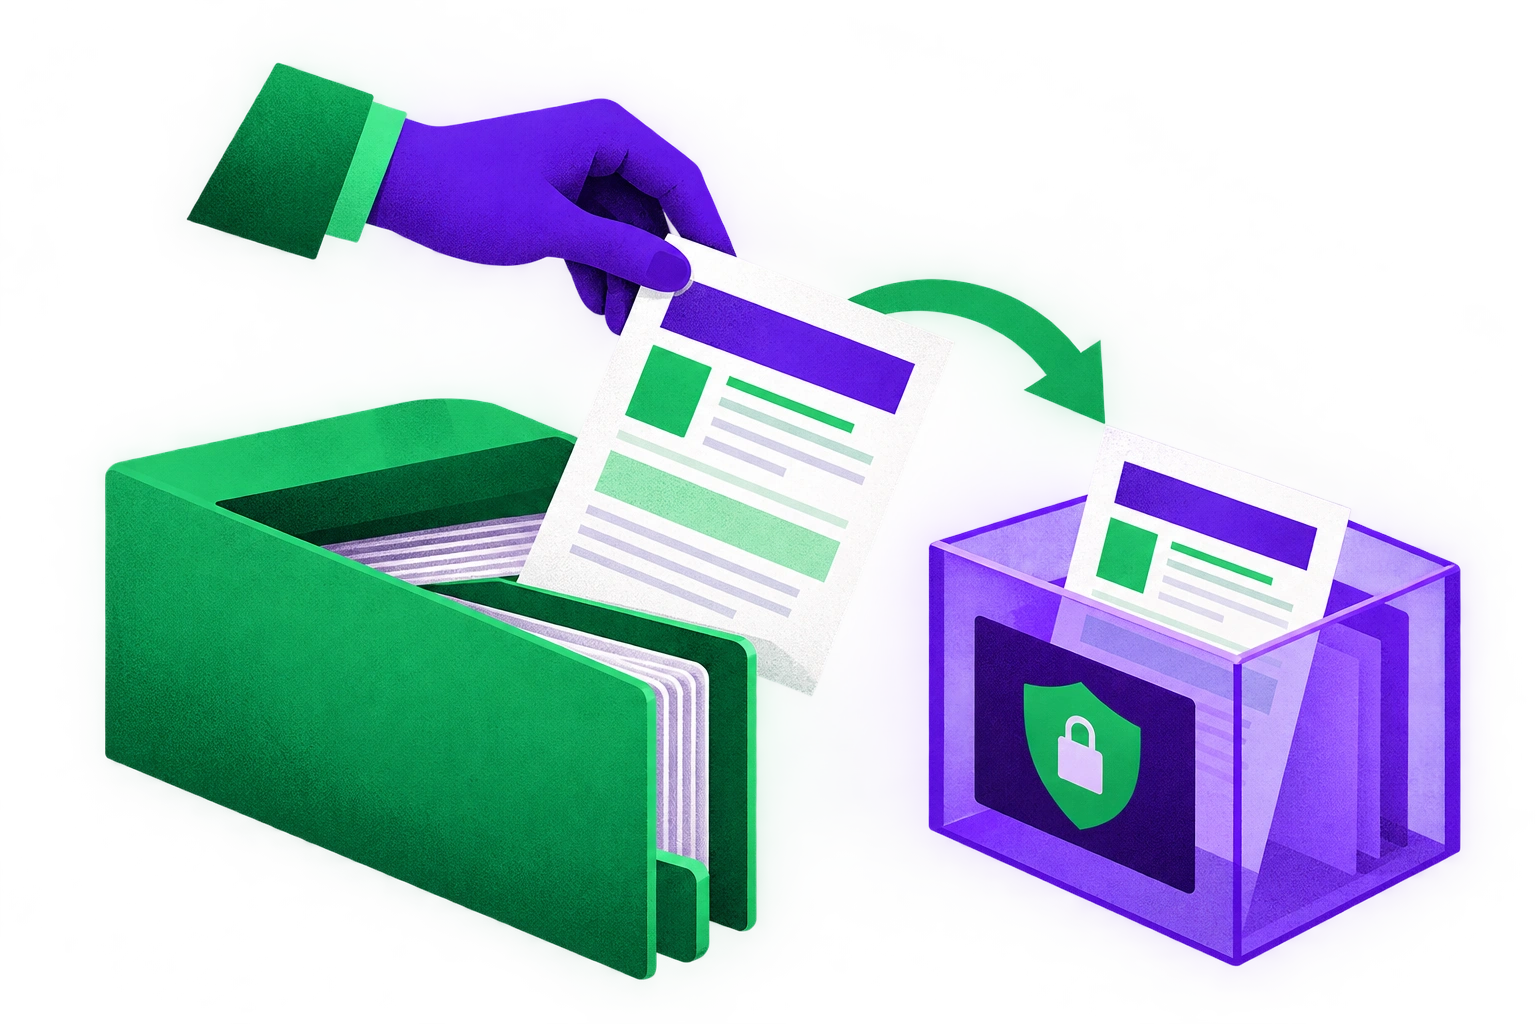
This workflow is slower than unrestricted trace inspection. It will also produce fewer examples. Budget for that cost instead of quietly replacing consent with a broad support role. Some incidents will remain unresolved because the customer cannot or will not disclose enough context; record that limit as an investigation outcome.
Offer a no-disclosure path too. A customer’s domain expert can describe the failure category and expected behavior without sending the underlying matter: for example, “the answer should have refused to cite a document this user could not access.” That report may not explain the precise cause, but it can identify an authorization test or an evaluation gap. It also gives affected users a route to improve the system. NIST’s AI Risk Management Framework calls for production monitoring, feedback and evaluations representative of deployment conditions; none of that requires routine engineer access to raw prompts.
Build inspectable eval worlds, not a copied production archive
Customer-approved failure reports should feed reproducible cases, not an ever-growing folder of real matters. Use wholly synthetic documents when approval for transformed data is unavailable. Where a customer approves a sanitized case, agree on the transformation, permitted uses and reviewers. “Anonymized” is not a sufficient specification: unusual facts, titles, citations, IDs and short excerpts may still identify the work.
The case should cover the workflow that failed. Specify documents, permissions, relevant records, expected deliverables and an expert-written scoring rubric. Test retrieval, tool use, authorization and output together. A model-only prompt test may pass while the agent retrieves the wrong version of a document or calls a tool outside the user’s permissions.
Legora’s BAR cases illustrate one approach: law-firm-supplied use cases with synthesized and/or anonymized data, verifiable rubrics written by legal professionals, and isolated runs. Its Eval World design snapshots documents, database records, permissions and blob state so a case can be rerun. Experiments pin an agent-harness variant to a commit SHA. Legora gives an example of 100 cases across four variants and five trials, totaling 2,000 runs. That describes its experiment, not a minimum viable eval program.
Start with cases that reflect your highest-risk tasks and known failures, then compare important task segments separately. Pin code, prompts, policies and relevant configuration so a regression has an attributable change. Track which failure categories remain unrepresented. Synthetic cases will miss novel production behavior; use customer reports and aggregate signals to revisit coverage without copying unreviewed production data into the test set.
Release checklist: prove the boundary and the fallback
Before enabling a confidential agent capability, require evidence for each of these decisions:
Data map: Every prompt, tool argument, exception, trace, ticket and eval field has a destination, retention rule, permitted viewer and authorization requirement.
Export test: Seeded confidential strings do not appear in unauthorized SDK exports, Collector output, baggage, support exports or retained records.
Review path: An authorized customer can inspect and approve a specific disclosure, with a documented purpose, expiry and deletion process. A no-disclosure report remains possible.
Quality gate: Deterministic privacy-leak tests and representative, version-pinned workflow evals pass for the tasks being released. Record coverage gaps rather than hiding them in an aggregate score.
Operating rule: Aggregate production indicators and customer feedback have owners. Exceptional access has a named approver and a separate permission path.
If a serious failure cannot be investigated within the agreed boundary, pause that capability or require human review. Do not silently expand trace collection to make the incident easier to debug. For teams integrating these controls into an existing product, AI agent development work should include the exception workflow and release gate alongside the agent itself. The boundary is part of whether the system can be maintained, not paperwork to finish after launch.